Metadata
Identification
Title: 1998 land cover map of
Source: Natural Resource Spatial Analysis Laboratory,
Date: 1998
Feature: Raster image
Projection: UTM 17, NAD83, GRS80
Scale: 30 X 30 m pixels, 1:24,000
Abstract:
This land cover map was produced from Landsat TM imagery
with a spatial resolution of 30x30m. The
classification process used six of the original seven bands of the imagery; the
120x120m thermal infrared band was removed from the data sets before
processing. Additional ancillary
geospatial and non-geospatial statistical data were incorporated in the mapping
process.
An accuracy assessment was performed using aerial videography, digital ortho quarter quads (DOQQ) and other ground information. The overall statewide accuracy is 85%. Although the data are available at a 30 m pixel resolution, accuracy was not assessed on patches of less than 4 pixels. A further description of the accuracy information will be found in the data quality statement.
Cautionary use statement:
These data can be used in a Geographic
It is important to note the mapping was performed at the scale of one county and users should exercise caution regarding reliability of the data at finer scales. In addition accuracy of the data is reported at the scale of the state. For this reason, it is recommended that additional field reconnaissance be used before performing analysis with the data at higher resolutions. Images used in the production of the land cover range from 1996-1998 and therefore do not reflect change that has occurred beyond these dates. We do intend to periodically update these maps if funding is available.
Description:
Data source information:
|
Row |
|
Date |
Date |
Date |
|
20 |
36 |
|
|
|
|
19 |
36 |
|
|
|
|
19 |
37 |
|
|
|
|
19 |
38 |
|
|
|
|
19 |
39 |
|
|
|
|
18 |
36 |
|
|
|
|
18 |
37 |
|
|
|
|
18 |
38 |
|
|
|
|
18 |
39 |
|
|
|
|
17 |
37 |
|
|
|
|
17 |
38 |
|
|
|
|
17 |
39 |
|
|
|
|
16 |
38 |
|
|
|
|
16 |
39 |
|
|
|
* Primary scene for mapping
Process overview:
The first step of the process involved creating subsets of
the leaf-off (winter) Landsat TM images by county.
Linear features such as transportation infrastructure, utility swaths, and
water bodies were then identified and classified using datasets obtained by the
GA GIS
Urban and agricultural areas selected from the National Land Cover Dataset (USGS 1999) and used to subset the raw 6-band images into areas of potential urban and agriculture. The subsets of raw imagery were then clustered using the Iterative Self-Organizing Data Analysis Technique (ISODATA). This clustering method, referred to as an unsupervised classification, uses spectral patterns to assign groupings of pixels into classes. The number of classes in each ISODATA image varied depending on the size of the subset and the complexity of the category and county. ISODATA images usually fell within a range of 25 to 100 classes. Classes from the initial ISODATA image that were difficult to classify were run through a second round of ISODATA processing (cluster bust).
Each of the clustered images resulting from the unsupervised classifications were interpreted using visual inspection of multiple dates of the raw TM images guided by a combination of ancillary data including; the black and white 1993 DOQQs, National Wetlands Inventory, digital elevation models, and polygonal hydrology features.
While leaf-off images were the primary data source for most unsupervised classifications, the spring images (leaf-on) were useful for separating clear-cut areas from agriculture/pasture, for reducing topographic effects in mountainous areas, and for identifying clear-cut areas from deciduous forest along the fall line and in sandhills.
The identification of low intensity residential areas was enhanced using road data provided by the Georgia Department of Transportation in conjunction with visual assessment of the DOQQ’s. The methods associated with mapping the extent of low intensity residential are reported in Epstein et al., in press.
Data Quality Statement:
For the accuracy assessment, the land cover map was
stratified by ecoregion and by land cover class. The metropolitan ![]() ,
where p is the presumed accuracy and s is the standard error (Cochran
1977). GAP requires a standard error of
8%, therefore with a presumed accuracy of 50%, 40 patches per cover class (as
an average) were necessary in each ecoregion. The total number of points was calculated by
multiplying 40 by the number of cover classes. Aerial extent per class was
calculated, and the final number of patches assessed per class was based on the
percent of aerial extent for that class in the region. A minimum of 5 points in a region was
selected for any given class. Only
patches of four or more pixels were randomly selected for interpretation.
,
where p is the presumed accuracy and s is the standard error (Cochran
1977). GAP requires a standard error of
8%, therefore with a presumed accuracy of 50%, 40 patches per cover class (as
an average) were necessary in each ecoregion. The total number of points was calculated by
multiplying 40 by the number of cover classes. Aerial extent per class was
calculated, and the final number of patches assessed per class was based on the
percent of aerial extent for that class in the region. A minimum of 5 points in a region was
selected for any given class. Only
patches of four or more pixels were randomly selected for interpretation.
In
all of
The equipment used for the assessment consisted of a Canon GL1 Digital Video Camcorder, a Horita FP-50/TR GPC GPS3 SMPTE Time Code Reader, a 13” television, and a computer using ArcView. The videocassettes were viewed on the television using the Horita Time Code Reader to display the time code on the television screen.
For each point, the interpreter identified a first and second choice of land cover classes, and entered a location confidence variable. This location information was used to compensate for changes in location due to the movement of the airplane during video filming. Interpreters assigned a one (1) for an interpretation where they could reasonably identify the location of the clump on the video and a zero (0) if the interpreter had very little confidence in the location.
In
the
A
total of 4240 points were used for the accuracy assessment. The table below
represents the combined accuracy assessment for the State of
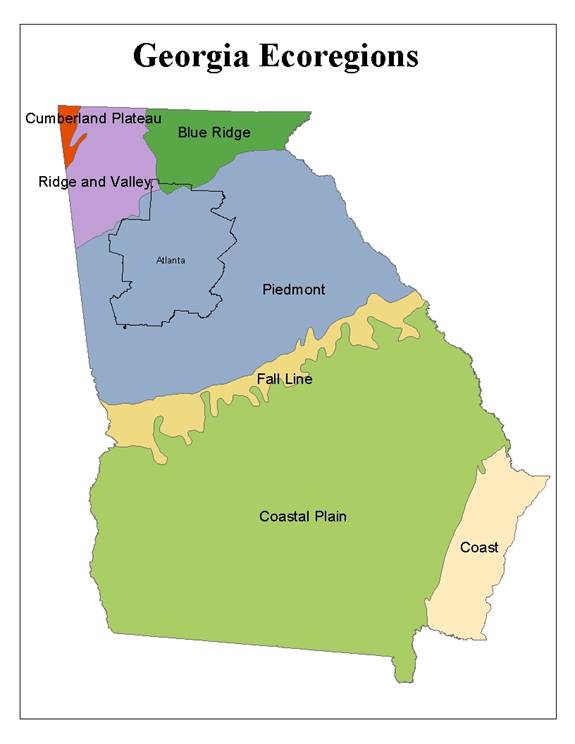
Figure 1. Ecoregion map of Georgia used for classification and accuracy assessment work. Based upon Keyes et al.
Attribute
|
Code |
Class Name |
Description |
|
07 |
Beaches/Dunes/Mud |
This class includes the following categories of information; beaches,
exposed sandbars, sand dunes, mud, dredge materials, and exposed lakeshore. |
|
11 |
Open Water |
This class includes all types of waterbodies:
lakes, rivers, ponds, ocean, industrial water, and aquaculture, which
contained water at the time of image acquisition. |
|
18 |
Transportation |
This class includes roads, railroads, airports, and runways. |
|
20 |
Utility Swaths |
This class includes vegetated linear features, which are maintained for
transmission lines and gas pipelines. |
|
22 |
Low Intensity Urban |
This class includes; single family residential areas, urban
recreational areas, cemeteries, playing fields, campus-like institutions,
parks, and schools. |
|
24 |
High Intensity Urban |
This class includes central business districts, multi-family dwellings,
commercial facilities, industrial facilities, and high impervious surface
areas of institutional facilities. |
|
31 |
Clearcut/Sparse |
This class includes areas that had been clearcut
within the past 5 years, as well as areas of sparse vegetation. |
|
33 |
Quarries/Strip Mines |
This class includes; mines and exposed rock and soil from industrial
uses, gravel pits. |
|
34 |
Rock Outcrop |
This class includes geological features such as rock outcrops, and
exposed mountaintops. |
|
41 |
Deciduous Forest |
This class is composed of forests, which contain at least 75% deciduous
trees in the canopy, deciduous mountain shrub/scrub areas, and deciduous
woodlands. |
|
42 |
Evergreen Forest |
This class is composed of forests, which contain at least 75% evergreen
trees, pine plantations, and evergreen woodlands. |
|
43 |
Mixed Forest |
This class includes forests with mixed deciduous/coniferous canopies,
natural vegetation within the fall line and coastal plain ecoregions,
mixed shrub/scrub vegetation, and mixed woodlands. |
|
73 |
Golf Courses |
Golf courses. |
|
80 |
Pasture |
This class includes pastures, and non-tilled grasses. |
|
83 |
Row Crop |
This class includes row crops agriculture, orchards, vineyards, groves,
and horticultural businesses. |
|
91 |
Forested Wetland |
This class includes all types of forested and shrub wetlands. |
|
92 |
Coastal Marsh |
Coastal freshwater and brackish marsh. |
|
93 |
Non-forested Wetland |
This class includes all freshwater emergent wetlands. |
Acknowledgements:
This project was funded by the following organizations: The Turner Foundation, The United States Geological Survey, Georgia Department of Natural Resources – Wildlife Resources Division, and the Sapelo Foundation.
We wish to acknowledge the following people for the
development of this land cover map, Dr.
Contact
Dr.
Natural Resources Spatial Analysis Laboratory
Institute of Ecology
University of Georgia
Athens, GA 30202
706-542-3577
lkramer@uga.edu